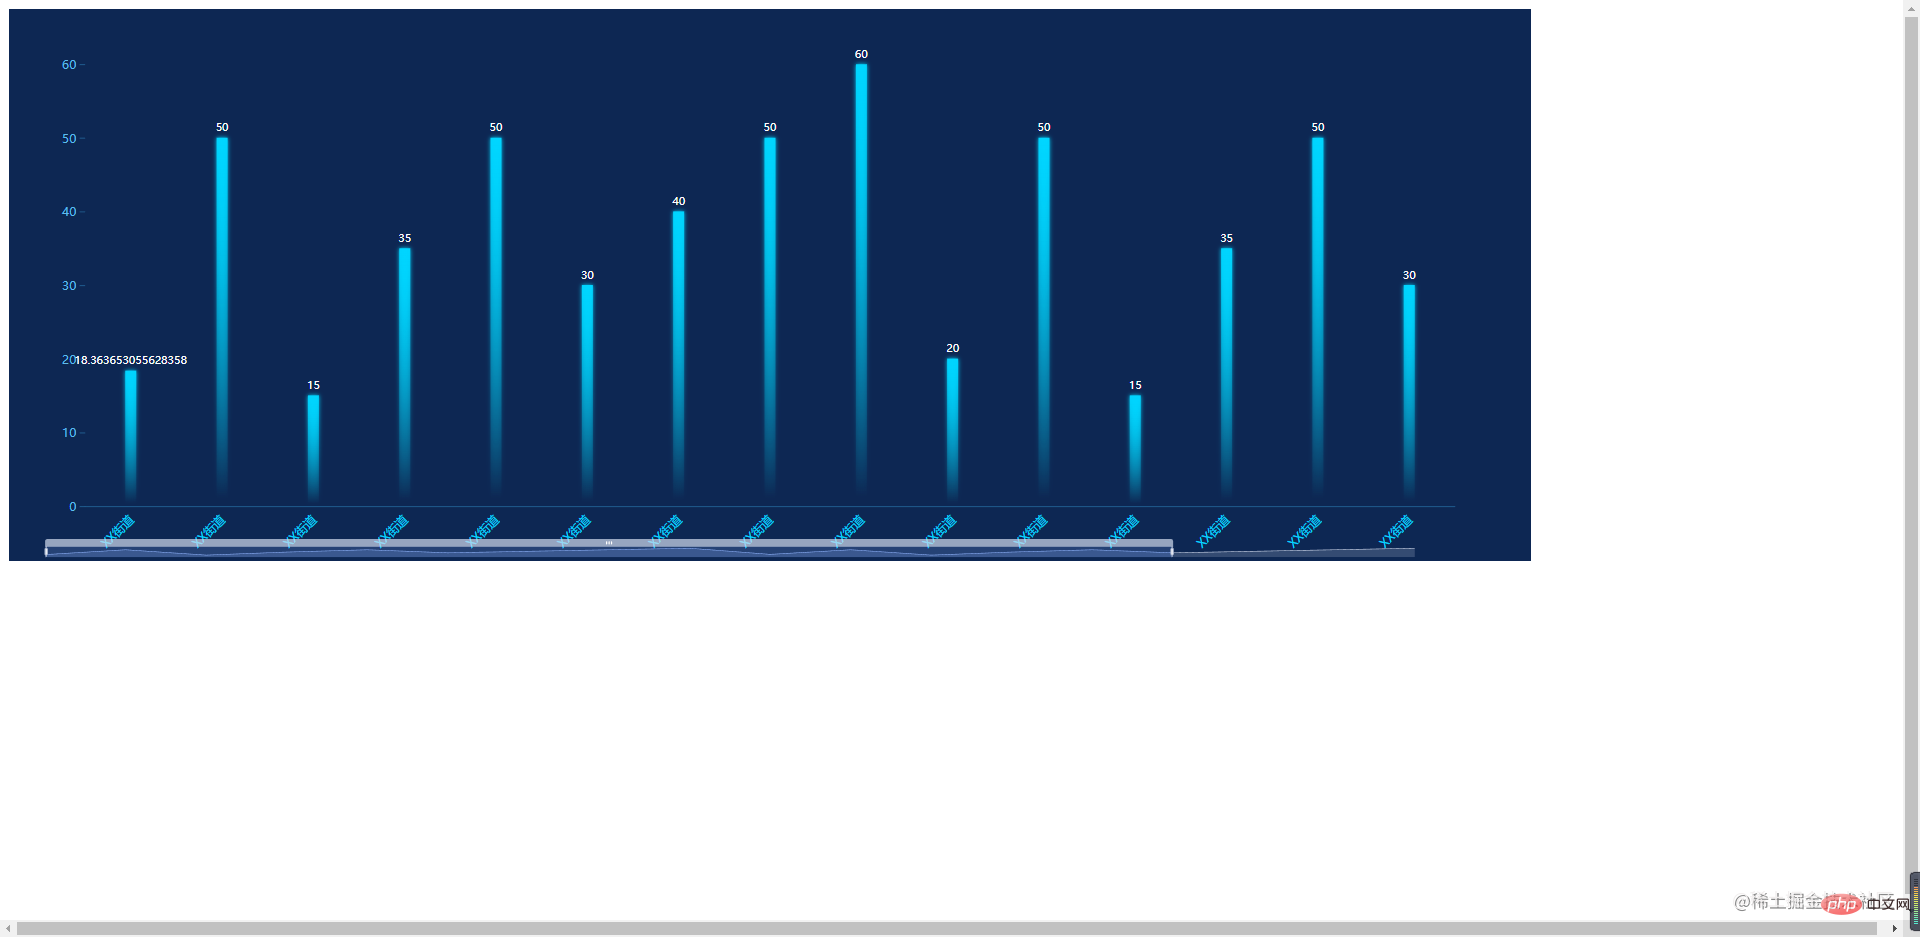
一文教你如何正确封装ECharts
本篇文章给大家带来了关于echarts的相关知识,其中主要跟大家聊一聊怎么封装echarts,感兴趣的朋友下面一起来看一下吧,希望对大家有帮助。
文章的开头总是很难水的,就不多说了
本文涉及 : TypeScript、Vue3、 echarts
因为 ECharts 的使用场景及其广阔,并且定制化的场景比较多,所以就不封装可以复用的组件了,在我看来每个组件还是需要一个独立的 option ,这里仅封装更好使用的 echats
目录
|--src
    |--components     // 组件
        |--echarts    // echats 封装目录
            |--echarts-types.ts    // 一些类型
            |--library.ts          // 为 echats 增加的一些功能
            |--useECharts.ts       // 主函数

        |--EChartsComponents
            |--a-echarts.vue      // 组件使用

|--App.vue
代码
library.ts
在 library.ts 中集中引入,挂载 echarts 需要用到的组件和功能
import * as echarts from 'echarts/core';

import {
        BarChart,
        LineChart,
        PieChart,
        MapChart,
        PictorialBarChart,
        RadarChart,
        ScatterChart
} from 'echarts/charts';

import {
        TitleComponent,
        TooltipComponent,
        GridComponent,
        PolarComponent,
        AriaComponent,
        ParallelComponent,
        LegendComponent,
        RadarComponent,
        ToolboxComponent,
        DataZoomComponent,
        VisualMapComponent,
        TimelineComponent,
        CalendarComponent,
        GraphicComponent
} from 'echarts/components';

echarts.use([
        LegendComponent,
        TitleComponent,
        TooltipComponent,
        GridComponent,
        PolarComponent,
        AriaComponent,
        ParallelComponent,
        BarChart,
        LineChart,
        PieChart,
        MapChart,
        RadarChart,
        PictorialBarChart,
        RadarComponent,
        ToolboxComponent,
        DataZoomComponent,
        VisualMapComponent,
        TimelineComponent,
        CalendarComponent,
        GraphicComponent,
        ScatterChart
]);

export default echarts;
echarts-types.ts
一些需要使用的类型,在这里规范
export enum RenderType {
        SVGRenderer = 'SVGRenderer',
        CanvasRenderer = 'SVGRenderer'
}

export enum ThemeType {
        Light = 'light',
        Default = 'default',
}
useECharts.ts 主要文件
引入需要使用的功能模块,EChartsOption 类型在使用时容易报红,这里暂时用 any
import { onMounted, onUnmounted, Ref, unref } from "vue";
import echarts from "./library";
// import type { EChartsOption } from 'echarts'
import { SVGRenderer, CanvasRenderer } from 'echarts/renderers'
import { RenderType, ThemeType } from './echarts-types'
export function useECharts(elparams: Ref<HTMLDivElement> | HTMLDivElement, autoUpdateSize: boolean = false, render: RenderType = RenderType.SVGRenderer, theme = ThemeType.Default) {
// 渲染模式
echarts.use(render === RenderType.SVGRenderer ? SVGRenderer : CanvasRenderer)
// echats实例
let echartsInstance: echarts.ECharts | null = null
// 初始化 echats实例
function initCharts() {
const el = unref(elparams)
if (!el) return
echartsInstance = echarts.init(el, theme)
}
// 配置
function setOption(option: any) {
showLoading()
if (!echartsInstance) initCharts()
if (!echartsInstance) return
echartsInstance.setOption(option)
hideLoading()
}
// 获取 echats实例
function getInstance() {
if (!echartsInstance) initCharts()
return echartsInstance
}
// 更新大小
function onResize() {
echartsInstance?.resize()
}
// 监听元素大小变化
function watchEl() {
if (animation) unref(elparams).style.transition = 'width 1s, height 1s'
const resizeObserve = new ResizeObserver(() => onResize())
resizeObserve.observe(unref(elparams))
}
// 显示加载状态
function showLoading() {
if (!echartsInstance) initCharts()
echartsInstance?.showLoading()
}
// 隐藏加载状态
function hideLoading() {
if (!echartsInstance) initCharts()
echartsInstance?.hideLoading()
}
// 生命钩子——组件挂载完成
onMounted(() => {
window.addEventListener('resize', onResize)
if (autoUpdateSize) watchEl()
})
// 生命钩子——页面销毁
onUnmounted(() => {
window.removeEventListener('resize', onResize)
})
return { setOptions, getInstance }
}在组件中的使用
a-echarts.vue 使用,我们现在只需要去找一些 option 就可以实现不同的图表了
这个还不错的网站,有很多示例 我们随便拿一个来试试吧,

把配置代码复制到下面,就可以看见效果了
<template>
        <div ref="MyEcharts"></div>
</template>

<script setup>
import { onMounted, Ref, ref } from "vue";
import echarts from "../echarts/library";

//获取echarts实例
const MyEcharts = ref<HTMLDivElement | null>(null)

const { setOption, getInstance } = useECharts(MyEcharts as Ref<HTMLDivElement>, false, true)

onMounted(() => {

        setOption(option);

        const echartsInstance = getInstance()

})

</script>
App.vue
<template> <echarts></echarts> </template> <script setup> import echarts from './components/EchartsComponents/a-echarts.vue' </script> <style scoped></style>

完毕! 感觉有帮助的话,求个小赞!!!
推荐学习:《》
以上就是一文教你如何正确封装ECharts的详细内容,更多请关注本站点其它相关文章!
本文地址:https://www.stayed.cn/item/27703
转载请注明出处。
本站部分内容来源于网络,如侵犯到您的权益,请 联系我

我的博客
人生若只如初见,何事秋风悲画扇。
我的标签
随笔档案
- 2024-02(2)
- 2023-06(1)
- 2023-05(1)
- 2023-04(14)
- 2023-03(3)
- 2023-01(6)
- 2022-12(5)
- 2022-11(5)
- 2022-07(2)
- 2022-06(4)
- 2022-05(3)
- 2022-03(1)
- 2021-12(6)
- 2021-11(1)
- 2021-10(3)
- 2021-09(5)
- 2021-07(5)
- 2021-02(2)
- 2021-01(7)
- 2020-12(18)
- 2020-11(14)
- 2020-10(12)
- 2020-09(10)
- 2020-08(22)
- 2020-07(2)
- 2020-06(1)
- 2020-04(5)
- 2020-03(9)
- 2020-02(7)
- 2020-01(9)
- 2019-12(8)
- 2019-11(10)
- 2019-10(11)
- 2019-09(17)
- 2019-08(16)
- 2019-07(6)
- 2019-06(3)
- 2019-04(1)
- 2019-03(8)
- 2019-02(5)
- 2019-01(1)
- 2018-11(2)
- 2018-10(3)
- 2018-09(1)
- 2018-08(3)
- 2018-07(3)
- 2018-06(7)
- 2018-04(4)
- 2018-03(5)
- 2018-02(4)
- 2018-01(22)
- 2017-12(3)
- 2017-11(5)
- 2017-10(15)
- 2017-09(26)
- 2017-08(1)
- 2017-07(3)