vue项目中怎么用echarts
使用方法:1、用“yarn add echarts”或“npm install echarts -s”或“cnpm install echarts -s”命令安装echarts;2、在main.js中用“import echarts from 'echarts' vue.prototype.$echarts = echarts”进行引入;3、在vue页面中调用相关api即可。

本教程操作环境:windows7系统、vue3版,DELL G3电脑。
Echarts 商业级数据图表,它是一个纯JavaScript的图标库,兼容绝大部分的浏览器,底层依赖轻量级的canvas类库ZRender,提供直观,生动,可交互,可高度个性化定制的数据可视化图表。创新的拖拽重计算、数据视图、值域漫游等特性大大增强了用户体验,赋予了用户对数据进行挖掘、整合的能力。
Echarts,它是一个与框架无关的 JS 图表库,但是它基于Js,这样很多框架都能使用它,例如Vue。
简单起步
安装 Echarts
以下几种安装方式择其一
本项目安装的是采用的yarn, echarts 版本号是 4.8.0
// yarn
yarn add echarts
// npm
npm install echarts -S
// cnpm
cnpm install echarts -S
全局引入
在main.js中
import echarts from 'echarts'
Vue.prototype.$echarts = echarts
到了这一步说明你已经把准备工作做完了
清空多余代码
我们先把页面其他不需要用到的代码给清除吧
<template>
<div class="home">
</div>
</template>
<script>
export default {
name: 'Home',
}
</script>创建一个容器
创建一个 id 为EChart 的div 作为容器 (使用id会有个小问题,在最后解答)
<div id="EChart" style="width: 300px; height: 300px;"></div>
创建一个方法
getRenderer() {
      console.log(this.$echarts);
      // 基于准备好的dom,初始化echarts实例
      let EChart = this.$echarts.init(document.getElementById("EChart"));
      // 配置参数
      let config = {
        title: { text: "悲伤日记" },
        tooltip: {},
        xAxis: {
          data: ["衬衫", "羊毛衫", "雪纺衫", "裤子", "高跟鞋", "袜子"],
        },
        yAxis: {},
        series: [
          {
            name: "销量",
            type: "bar",
            data: [5, 20, 36, 10, 10, 20],
          },
        ],
      };
      // 设置参数
    EChart.setOption(config);
},
生命周期中调用此方法
mounted() {
    // 在生命周期中调用 getRenderer 方法
    this.getRenderer();
},
请看大屏幕
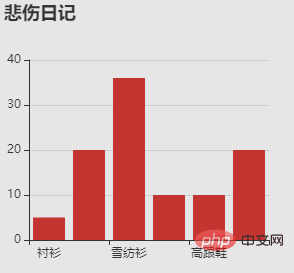
吃瓜群众:“这特么不是官方示例么?能不能炫一点”
严老师:“说实话确实有点low ,不要慌这才哪到哪呢,我们先从基础讲堂开始嘛”
先了解其参数
先讲讲其中简单的一些配置参数,枯燥乏味,但是摸清楚之后,以后画图那是顺手得一**
先整点简单、常用的来看看(备注里面皆是对应API地址)
| 参数名 | 作用 | 备注 |
|---|---|---|
title | 作为图表名称 | https://echarts.apache.org/zh/option.html#title |
legend | 作为图表的标记 | https://echarts.apache.org/zh/option.html#legend |
xAxis | 作为图表的X轴 | https://echarts.apache.org/zh/option.html#xAxis |
yAxis | 作为图表的Y轴 | https://echarts.apache.org/zh/option.html#yAxis |
series | 作为图表的系列 | https://echarts.apache.org/zh/option.html#series |
color | 作为图表的颜色列表 | https://echarts.apache.org/zh/option.html#color |
掰扯了这么多,估计大家心里也没个底,实战一下吧
来造作一下下
series type
来吧!!展示
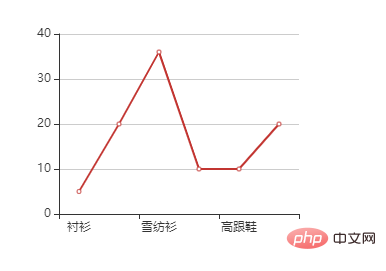
折线图
修改折线图,复制上面的config代码
只用修改一处地方,那就是series 中的type属性为line即可
let config = {
   title: { text: "悲伤日记" },
   tooltip: {},
   xAxis: {
      data: ["衬衫", "羊毛衫", "雪纺衫", "裤子", "高跟鞋", "袜子"],
    },
    yAxis: {},
    series: [
       {
            name: "销量",
            type: "line",
            data: [5, 20, 36, 10, 10, 20],
       },
    ],
};
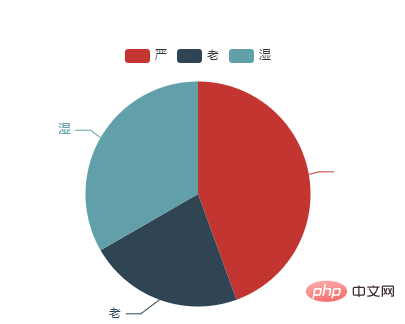
饼状图
饼状图,我们也来看看,将type修改为pie
当然我们需要把多余的X轴Y轴配置删除咯,data数据格式也需要修改一下
let config = {
    tooltip: {},
    legend:{
       data : ["严","老","湿"]
    },
    series: [
       {
          name: "销量",
          type: "pie",
          data: [
              {value:20,name:"严"},
              {value:10,name:"老"},
              {value:15,name:"湿"}
          ],
        },
    ],
};
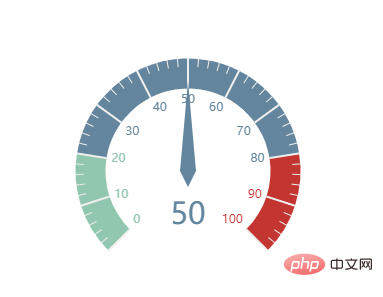
仪表盘
仪表盘将 type 修改为 gauge
let config = {
    series: [
       {
         name: "销量",
         type: "gauge",
         data: [50],
       },
    ],
};
嗯~ 看起来有那么一点味道了
画一个老严的脸
let config = {
      series: [
          {
            name: "销量",
            type: "funnel",
            data: [
                 {value: 60, name: '访问'},
                 {value: 40, name: '咨询'},
                 {value: 20, name: '订单'},
                 {value: 80, name: '点击'},
                 {value: 100, name: '展现'}
              ]
           },
     ],
};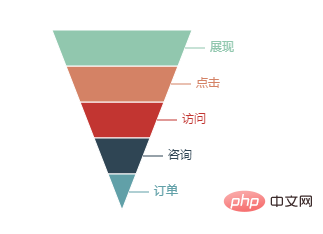
哈哈哈 倒三角就是老严的脸了 (脑补一下下)
legend
刚刚其实我们已经用到了这个参数噢 ps:饼状图
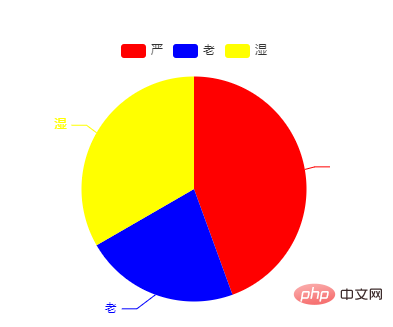
legend 可以作为图表的标记或颜色的名称描述(专业名词:图例)
它的type有两个参数plain || scroll
默认为plain 当图表内容比较丰富的时候可以使用 scroll 可以带有滚动操作
color
都说颜色是Web的灵魂所在,每一个人都是画手
官方默认配色 :
['#c23531','#2f4554', '#61a0a8', '#d48265', '#91c7ae','#749f83', '#ca8622', '#bda29a','#6e7074', '#546570', '#c4ccd3']
我们也可以自己修改颜色,规则是按数据对应的index找color颜色
例如这样:
let config = {
     color:["red","blue","yellow"],
    legend:{
            data : ["严","老","湿"]
    },
    series: [
            {
               name: "销量",
               type: "pie",
               data: [
                    {value:20,name:"严"},
                    {value:10,name:"老"},
                    {value:15,name:"湿"}
               ],
          },
    ],
};
yAxis
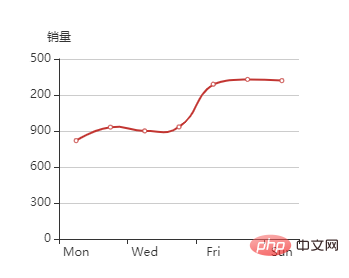
我们还是以线条为参考8
先看看基础篇,我们在y轴声明了一个name
let config = {
    xAxis: {
        type: 'category',
        data: ['Mon', 'Tue', 'Wed', 'Thu', 'Fri', 'Sat', 'Sun']
    },
    yAxis:[ {
        name:"销量",
        type: 'value'
    }],
    series: [{
        name:'销量',
        data: [820, 932, 901, 934, 1290, 1330, 1320],
        type: 'line',
        smooth: true
    }]
};
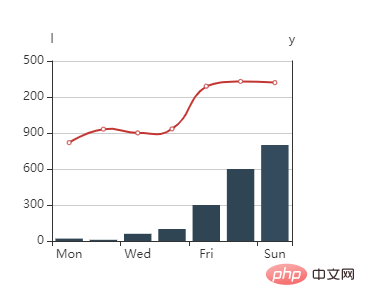
但是有时候呢,我们会根据需求,要做一个双Y轴,顾名思义双Y轴,在加一个Y轴就好了
let config = {
    xAxis: {
        type: 'category',
        data: ['Mon', 'Tue', 'Wed', 'Thu', 'Fri', 'Sat', 'Sun']
    },
    yAxis:[ {
        name:"l",
        type: 'value'
    }, {
        name:"r",
        type: 'value'
    }],
    series: [{
        name:'l',
        data: [820, 932, 901, 934, 1290, 1330, 1320],
        type: 'line',
        smooth: true
    },
    {
        name:'r',
        data: [20, 10, 60, 100, 300, 600, 800],
        type: 'bar',
    }]
}
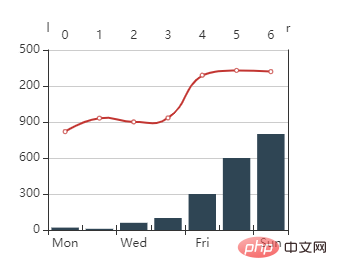
xAxis
x轴与y轴基本同理,直接改成数组就成为双x轴了
let config = {
    xAxis: [{
        type: 'category',
        data: ['Mon', 'Tue', 'Wed', 'Thu', 'Fri', 'Sat', 'Sun']
    },{
        type: 'category',
        data: ['0', '1', '2', '3', '4', '5', '6']
    }],
    yAxis:[{
        name:"l",
        type: 'value'
    }, {
        name:"r",
        type: 'value'
    }],
    series: [{
        name:'l',
        data: [820, 932, 901, 934, 1290, 1330, 1320],
        type: 'line',
        smooth: true
    },
    {
        name:'r',
        data: [20, 10, 60, 100, 300, 600, 800],
        type: 'bar',
    }]
};
到了上面基础篇也就差不多了
使用id为问题所在
其实我们讲了这么多,我们梳理梳理最开始的问题
id重名怎么办?
数据多个渲染怎么办?
答案:使用ref,因为vue是单页面,使用id出现 重名会导致渲染问题
具体怎么使用我们来看看
<div ref="EChart" style="width: 300px; height: 300px;"></div>
// 同样的初始化参数 但是我们此次使用的是ref
let EChart = this.$echarts.init(this.$refs.EChart)
// 配置参数
let config = {
    xAxis: [{
        type: 'category',
        data: ['Mon', 'Tue', 'Wed', 'Thu', 'Fri', 'Sat', 'Sun']
    },{
        type: 'category',
        data: ['0', '1', '2', '3', '4', '5', '6']
    }],
    yAxis:[{
        name:"l",
        type: 'value'
    }, {
        name:"r",
        type: 'value'
    }],
    series: [{
        name:'l',
        data: [820, 932, 901, 934, 1290, 1330, 1320],
        type: 'line',
        smooth: true
    },
    {
        name:'r',
        data: [20, 10, 60, 100, 300, 600, 800],
        type: 'bar',
    }]
};
// 设置参数
EChart.setOption(config);
相关推荐:
以上就是vue项目中怎么用echarts的详细内容,更多请关注本站点其它相关文章!
本文地址:https://www.stayed.cn/item/26825
转载请注明出处。
本站部分内容来源于网络,如侵犯到您的权益,请 联系我

我的博客
人生若只如初见,何事秋风悲画扇。
我的标签
随笔档案
- 2024-02(2)
- 2023-06(1)
- 2023-05(1)
- 2023-04(14)
- 2023-03(3)
- 2023-01(6)
- 2022-12(5)
- 2022-11(5)
- 2022-07(2)
- 2022-06(4)
- 2022-05(3)
- 2022-03(1)
- 2021-12(6)
- 2021-11(1)
- 2021-10(3)
- 2021-09(5)
- 2021-07(5)
- 2021-02(2)
- 2021-01(7)
- 2020-12(18)
- 2020-11(14)
- 2020-10(12)
- 2020-09(10)
- 2020-08(22)
- 2020-07(2)
- 2020-06(1)
- 2020-04(5)
- 2020-03(9)
- 2020-02(7)
- 2020-01(9)
- 2019-12(8)
- 2019-11(10)
- 2019-10(11)
- 2019-09(17)
- 2019-08(16)
- 2019-07(6)
- 2019-06(3)
- 2019-04(1)
- 2019-03(8)
- 2019-02(5)
- 2019-01(1)
- 2018-11(2)
- 2018-10(3)
- 2018-09(1)
- 2018-08(3)
- 2018-07(3)
- 2018-06(7)
- 2018-04(4)
- 2018-03(5)
- 2018-02(4)
- 2018-01(22)
- 2017-12(3)
- 2017-11(5)
- 2017-10(15)
- 2017-09(26)
- 2017-08(1)
- 2017-07(3)